
Introduction
Most Kenyan SME owners and managers still make important decisions using a mix of intuition, last week's numbers, and scattered information from WhatsApp chats, Excel sheets, basic accounting software, and CRM notes. They spend hours every week pulling reports manually or asking team members for updates on leads, revenue, expenses, appointments, or project status.
This approach worked when businesses were smaller and slower. In 2026, with faster market changes, higher competition, and more data flowing through multiple channels, gut-feel decisions carry growing risk. Many owners only realise cash flow is tightening, leads are slowing, or no-shows are rising when it is already affecting the business.
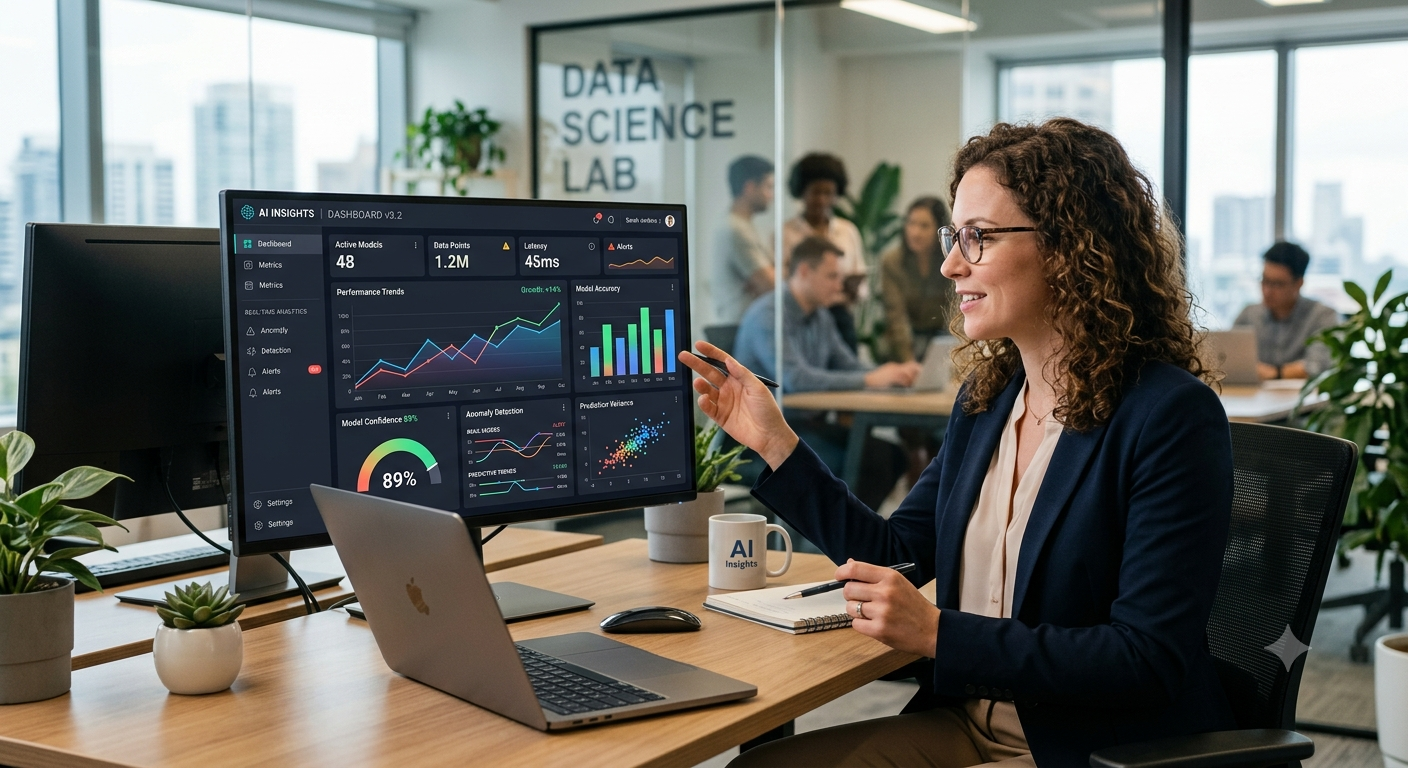
AI-powered business dashboards solve this by automatically pulling data from your website, WhatsApp AI chatbot, voice systems, CRM, accounting tools, and other sources into one clear, real-time view. They highlight what matters most — lead conversion trends, revenue per available slot, cash flow forecasts, staff utilisation, or customer acquisition costs — and often surface early warnings before problems become serious.
For Kenyan businesses in real estate, healthcare, professional services, hospitality, and financial services, these dashboards turn fragmented information into actionable insight. This guide explains what AI-powered dashboards actually deliver, why they matter now for Kenyan SMEs, and how to get started with practical steps tailored to local realities.
Why Gut-Feel Decisions Are Becoming Riskier for Kenyan SMEs
Kenyan SMEs operate in dynamic conditions. Lead volumes can shift quickly due to seasonality, competition, or economic changes. Cash flow is often tight and timing-sensitive. Staff costs and operational expenses need close monitoring. Many businesses now generate data across multiple channels — website inquiries, WhatsApp messages, phone calls, and in-person interactions — but lack a single place to see the full picture.
Relying on manual reports or memory means decisions are often based on incomplete or outdated information. By the time trends become obvious through manual tracking, opportunities may have been missed and problems may have already grown. AI dashboards close this gap by continuously monitoring key metrics and presenting them clearly.
What AI-Powered Dashboards Actually Do for Kenyan Businesses
Unlike basic reporting tools or static Excel sheets, AI-powered dashboards go further:
- Automatically consolidate data from multiple sources (website, WhatsApp chatbot, CRM, accounting software, calendar/booking systems).
- Highlight trends, patterns, and anomalies in real time (for example, a sudden drop in qualified leads or rising no-show rates).
- Provide forecasts and scenario modelling (such as expected cash flow based on current pipeline and historical patterns).
- Send alerts when key metrics move outside normal ranges.
- Allow drill-down from high-level overview to specific details without manual data hunting.
The result is that owners and managers spend far less time gathering information and more time acting on it. Decisions about marketing spend, staffing, pricing, follow-up processes, or new service offerings become faster and better informed.
Real-World Examples for Kenyan SMEs
- Real estate agencies can see lead sources, qualification rates, viewing-to-offer conversion, and average time to close — all updated daily instead of weekly.
- Private clinics and hospitals can track appointment fill rates, no-show trends by day or doctor, revenue per available slot, and patient acquisition sources in one view.
- Professional service firms (law, accounting, consulting) can monitor billable utilisation, pipeline value by stage, proposal win rates, and average time from inquiry to engagement.
- Hotels, lodges, and tour operators can view occupancy forecasts, revenue per available room, booking source performance, and guest request patterns.
In each case, the dashboard turns what used to require multiple manual reports into a single, always-current view that anyone on the leadership team can understand at a glance.
Traditional Reporting vs AI-Powered Dashboards
| Aspect | Traditional / Manual Reporting | AI-Powered Business Dashboard |
|---|---|---|
| Data freshness | Weekly or monthly | Real-time or near real-time |
| Time spent gathering data | Several hours per week | Minutes to review |
| Ability to spot trends early | Often reactive | Proactive alerts and pattern detection |
| Forecasting | Difficult and manual | Built-in forecasting and scenarios |
| Accessibility | Usually limited to one or two people | Shared view for owners, managers, and key staff |
| Integration across channels | Fragmented (WhatsApp, website, CRM, accounts) | Consolidated from multiple sources |
| Decision speed | Slower, based on past data | Faster, based on current reality |
How to Get Started with AI-Powered Dashboards
Most Kenyan SMEs do not need to replace every system they already use. The practical path usually involves:
- Identify the 5–8 metrics that actually drive your business — Focus on lead volume and quality, conversion rates, revenue or cash flow indicators, operational efficiency (no-shows, utilisation), and customer acquisition cost. Avoid trying to track everything at once.
- Connect your existing data sources — Website analytics, WhatsApp Business or AI chatbot data, CRM or lead tracking, accounting software, and calendar/booking systems. A good partner can integrate these without forcing major changes to your current tools.
- Start simple and expand — Begin with a core dashboard that answers the questions you ask most often. Add more sophistication (forecasting, alerts, role-based views) as you see value.
- Make it accessible and actionable — The best dashboards are used daily or weekly by decision-makers. They should be clear enough that you do not need a data analyst to interpret them.
- Review and refine regularly — As your business evolves, the metrics that matter most may change. Strong implementations include regular reviews to keep the dashboard aligned with current priorities.
Frequently Asked Questions
Do I need to change all my existing software to get a good dashboard?
How much technical knowledge do I need to use these dashboards?
What kind of ROI can I expect from an AI dashboard?
Is my data secure?
How long does it take to implement a useful dashboard?
Can the dashboard work with my WhatsApp AI chatbot and website?
Conclusion
Kenyan SMEs that continue relying primarily on gut-feel and manual reporting are increasingly at a disadvantage. The businesses gaining an edge are those that can see what is actually happening in their operations and pipeline in real time — and act on it quickly.
AI-powered business dashboards make this possible without requiring owners or managers to become data analysts. They consolidate information from the systems you already use, highlight what matters, and surface opportunities or risks early.
When these dashboards are part of a connected revenue system — alongside an optimised website, WhatsApp AI chatbots, and other automation — they turn data into one of your most practical competitive advantages.
If you want to understand how much time your team currently spends gathering information and what a tailored AI-powered dashboard could look like for your specific business, start with our free AI Readiness Snapshot. It includes an assessment of your current reporting and visibility gaps plus clear recommendations.
Or speak directly with our team about building the connected systems and dashboards that help you move from gut-feel decisions to confident, real-time insights.
Your business. Multiplied.
See where your business stands
Take the free AI Readiness Snapshot to find your biggest visibility gaps and the highest-impact opportunities for your business.
Comments
No comments yet — be the first to share your thoughts.